

Fast Company 2018
HUSH hosted nearly 80 people at Navy Yard studio in conjunction with the Fast Company Festival and the client partner at Google.
The goal of the interaction activity was to demystify the design process through collaborative making. Guests tapped into their own data and uncovered its creative potential in a simple and beautiful way.
2018.9 - 2018.10
My Role: Project Lead: Design, Prototype and Production
Tool: Cinema4D, JavaScript
Core Team: Eddy Nieto, Danielle Towslee, Kari Fry.
Studio: HUSH

The biggest challenge is to create this experience for people who never worked with data before. We decide to make this activity a hands on physical experience for visitors. They will be able to make and take home the unique data visualization. The following are some ideas I came up with:
Color Collage. Use different color as data input, each color represent an answers of the given questions.


Grid and Pattern. Use dot position as data points. Each row represents a question, each dot represents an answer.


Color Layers. Also use color as data input. Color Layers plays with the idea that two colors layer up will create a new color.


After consideration we choose the idea Color Layers and choose acrylic as the materials.
The acrylic pieces will be laser-cut into different shapes, with cutouts to align with the posts. Each shape will be cut from differently colored translucent acrylic, and will stack on top of each other.


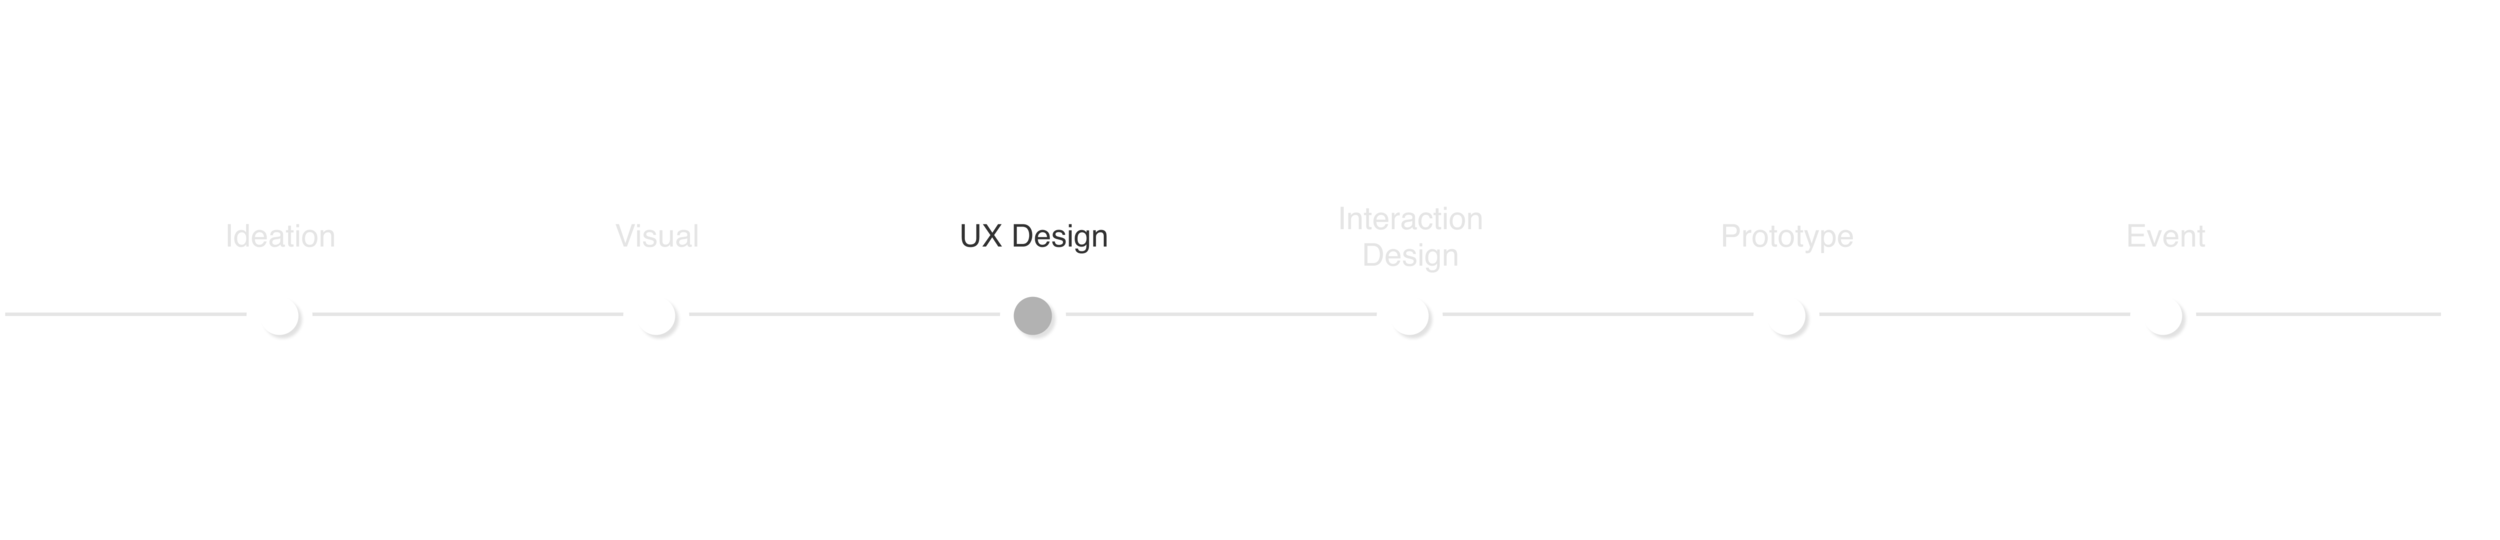
Visual and Material Study
Challenge:
How to intuitively create data visualization looks appealing both individually and as a group?
Goals:
Find the right physical material to create data visualization

User Flow
The interaction activity only has 30 minutes in time budget, which means users will spend less than 15 minutes with their full attention to make the data board. Therefore, the experiences should reduce the distraction and learning curve.
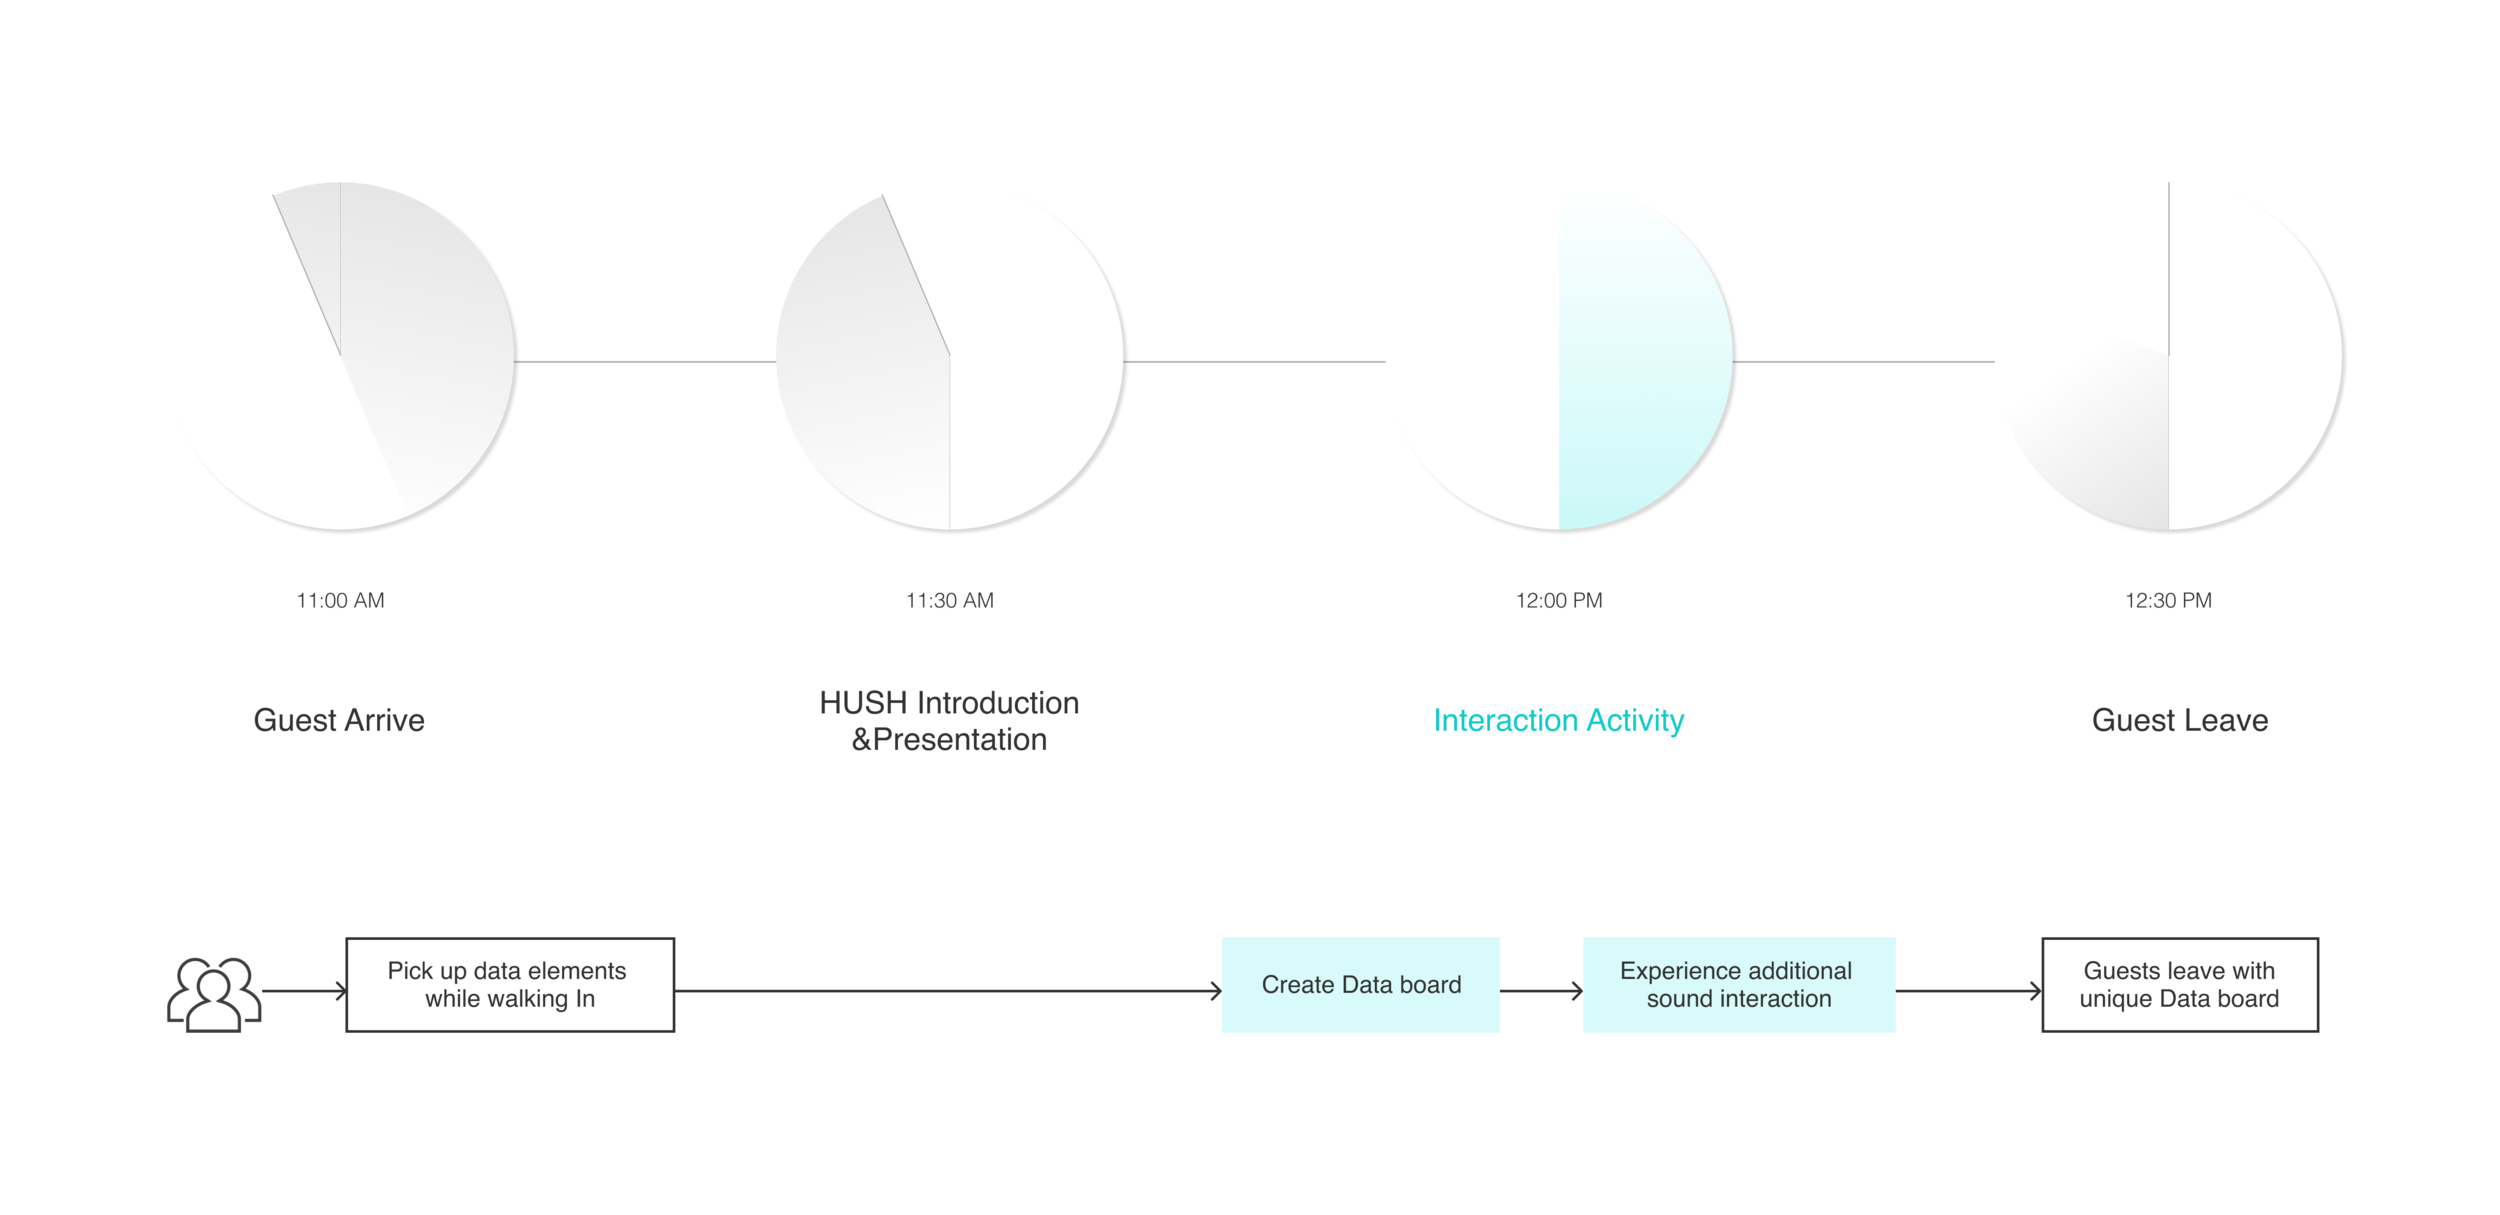

Data Visualization Creation Process
We choose to use visitor’s ID card as the Data Point. People carry ID card everywhere, it contains all the data that can prove one’s identity and people hardly aware of that. Also, using a daily item user is already familiar with can save the trouble of over think and look for answers during the 15 minutes activity.
User will get 6 different acrylic geometry shapes with 2 different colors. Each shape represents a question and each color represents a binary answer.


Additional interaction with sound
The acrylic board will “play“ interactive music based on different color combination.


I use different tools to created different prototypes for internal and external communication.
Cinema 4D

Physical prototype with acrylic

Sound Interactive prototype with Java Script:


